
In our last post, data scientist and Google Analytics expert, Kushal Sharma, shared the basics of Google Analytics with the TPM team, including: the information Google collects, how it collects it, and how the reports can be viewed. Catch up here.
This week, Kushal dives a little deeper into Google Analytics for Marketers, explaining how to create custom dimensions in Google Analytics and use them to perform A/B testing to track user behavior on your site. The post covers:
Google Analytics for Marketers:
1. Custom Dimensions
Custom dimensions are similar to regular dimensions in Google Analytics (i.e. the rows in your Google Analytics tables), however, custom dimensions are created by you to collect and analyze data that isn’t automatically tracked in Google Analytics such as:
Data collected by Google Analytics:
- Users who see page variant A versus page variant B on an A/B test
- Users who download a certain asset versus those who don’t
- A user of your product or service versus a random visitor
To create a custom dimension, you have to define custom dimensions values in Google Analytics. Each Google Analytics property has 20 available indices for custom dimensions.
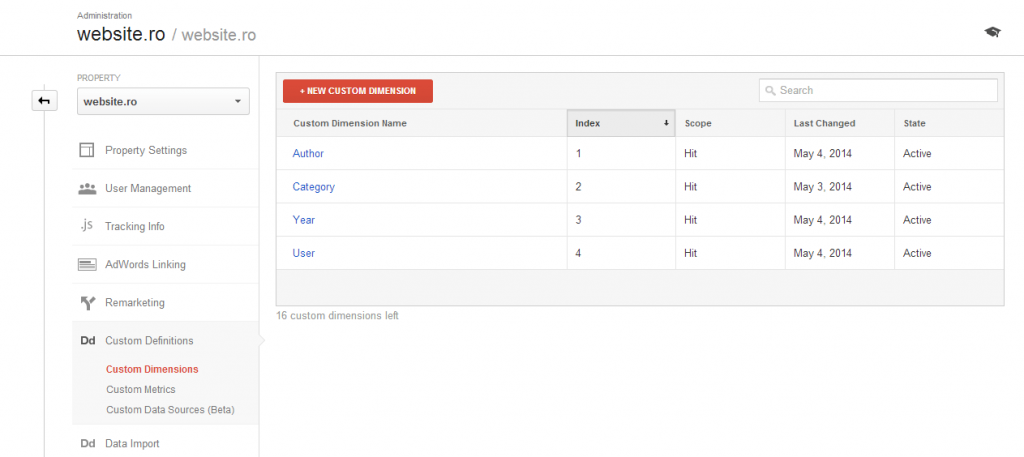
Custom dimensions in Google Analytics
You can use the following configurations values in your custom dimension:
- Name: The name that will appear on your report for the custom dimension
- Scope: Where the data of the custom dimension is applied
- Active: Whether or not the data for the custom dimension will be gathered and reported
Firstly, you must create a name for your custom dimension and specify its other configuration values. Google Analytics will assign an index number for you to use to reference the dimension later on.
The scope of a custom dimension is important as it can help you segment your data in very powerful ways.
For example, if you want to track the behavior of users who downloaded a certain asset versus those who didn’t, you should set the custom dimension scope to the user level. That way, you can split your traffic into two segments and analyze users’ page behavior to understand if the download of the asset leads to further desirable actions.
If, however, you want to study the behavior of someone who visits a page from your blog and then visits another page on the website, you can apply a session-level scope. A user-level scope will result in you losing the data from all of their previous visits but a session-level scope will help you analyze user behavior based on the entry point within each individual session.
There is also the ability to create hit-level custom dimensions. These allow you to track the behavior on one page (every click, download, action).
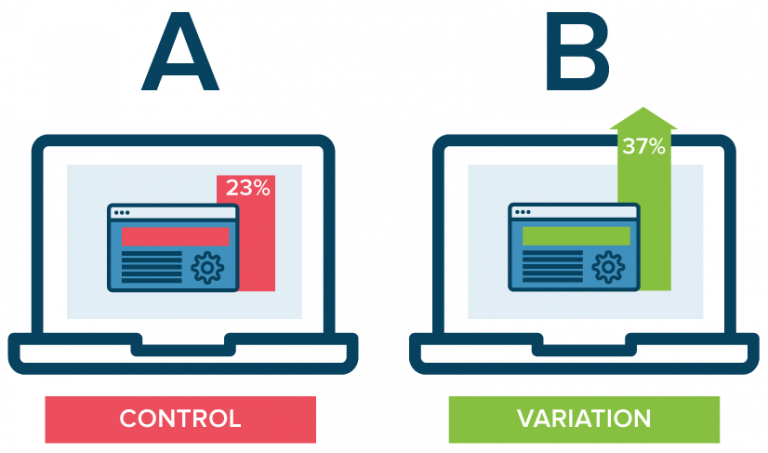
2. A/B Testing
A/B testing (sometimes referred to as split testing) originated from the statistical technique known as two-sample hypothesis testing. This testing is applied to understand whether the difference between two samples (version A and version B) is statistically significant. A/B testing involves:
- Measuring the conversion rates of two samples (the people who visited version A, and those who visited version B)
- Performing a two-sample hypothesis test on those conversion rates to calculate the statistical significance
- If the statistical significance is at an acceptable level (e.g. 95% or above), drawing some conclusions from it (e.g. whatever you changed on version B created this difference)
To perform A/B Testing with custom dimensions, your web developer can help set up the trigger that will pass the test variant name to the right custom dimension in Google Analytics.
It’s important to ensure that the right goals are set up in Google Analytics for the conversion you want to optimize for. Note that, the more goals a user can complete, the more traffic you’ll need to get in order to see statistically significant results.
Once everything is set up and tested, you can create a custom report in Google Analytics to specifically measure your goal conversions for the specified custom dimensions. The conversion rates can then be fed into a simple t-test calculator to understand if a statistical significance was achieved.
There are many different tools that you can use to help simplify A/B testing and optimization. These include:
*For email A/B testing. Most marketing automation software as this ability.
3. Tracking Conversions with Google Ads
Most marketers will perform A/B testing to optimize the performance of ad spend so it’s important to understand how Google Ads works.
Google Ads provides a cookie to a user’s browser once they click on the ad. The cookie can be programmed to last from 7 days up to 30 days.
Within those 30 days, if the user carrying this cookie takes an action on your website, Google Ads will consider that action a ‘conversion’ and will attribute that conversion to the ad click (and they will charge you for it, if that’s how the pricing is set up).
Google Ads has built-in attribution models so you can see how search terms affect your conversions from a first-click, linear, last-click, or other available perspectives.
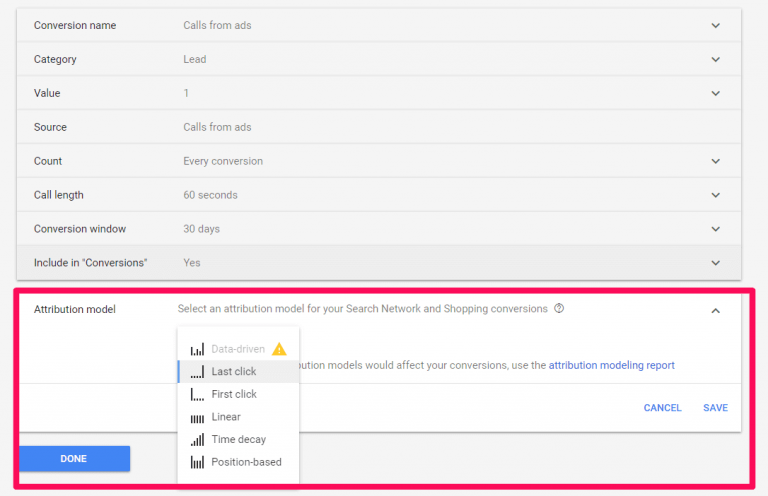
Attribution models in Google Ads
- Last click: Gives all credit for the conversion to the last-clicked ad and corresponding keyword.
- First click: Gives all credit for the conversion to the first-clicked ad and corresponding keyword.
- Linear: Distributes the credit for the conversion equally across all ad interactions on the path.
- Time decay: Gives more credit to ad interactions that happened closer in time to the conversion.
- Position-based: Gives 40% of credit to both the first and last ad interactions and corresponding keywords, with the remaining 20% spread out across the other ad interactions on the path.
- Data-driven: Distributes credit for the conversion based on your past data for this conversion action. It’s different from the other models, in that it uses your account’s data to calculate the actual contribution of each interaction across the conversion path. Note: This is only available to accounts with enough data.
Google Analytics and Google Ads data can be combined so you can track the entire customer journey and understand whether the ad click was something that happened at the start of the journey or in the middle.
4. Pop-Up Surveys
While Google Analytics can tell you what people are doing on your site, pop-up surveys can tell you why they’re doing it!
Qualaroo is a software that allows you to create small pop-up surveys on your web pages.
When used strategically, these surveys can provide you with incredible qualitative insight into your visitors’ needs and experiences while visiting your website.
These insights can help you to create new hypotheses about page design for A/B testing.
For example, Qualaroo can be set to trigger a survey if a person chooses to close a page before hitting the submit button. In that trigger, you can use Qualaroo to ask why they didn’t take the desired action (e.g. long form). The responses provide some great insight into key reasons why users are failing to convert.
You can also use Qualaroo to uncover key reasons for the user’s visit. For example, you can trigger a pop-up to ask users why they are leaving (e.g. lack of useful information, poor mobile experience, etc.). This can help align brand messaging with audience needs and ensure that your marketing is targeting the right individuals.

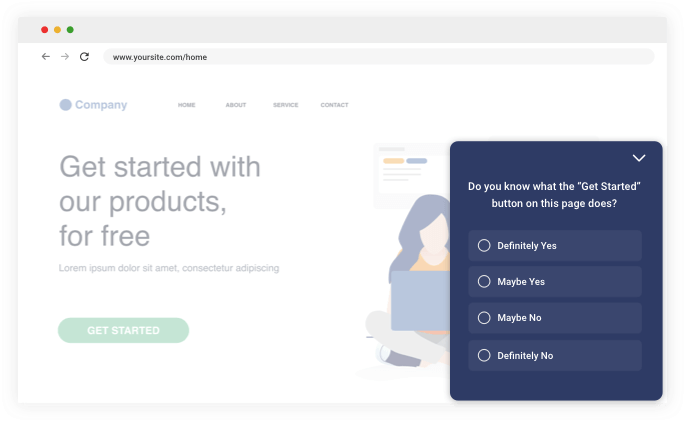
Qualaroo pop-ups
5. Heatmaps
Heatmaps of visitor activity on a page allow you to understand where a majority of your visitors tend to click and how far down the page they make it. Crazy Egg is one heatmap solution provider.

Crazy Egg heatmap
This data can be combined with user psychology research in interesting ways. For example, users who make decisions based on either impulse or third-party validation need to see the emotional appeal early on as they don’t stay on a page too long. Users who like to study a lot of detail need to see intricate details in a logical order.
In conjunction with insights from Qualaroo, this data can also provide incredible insights for A/B testing and user experience improvements.
6. Page Value and Using it to Prove ROI
In A/B testing, knowing a page value also allows you to understand the monetary impact of improvements in conversion which helps you build return on investment models.
To calculate a page value, you need to have a good idea of how much any particular conversion is worth.
For example, a plan page can be tied to goals for each plan sign up. If those plans represent fixed monthly revenue, that revenue number can be attached to goal conversions.
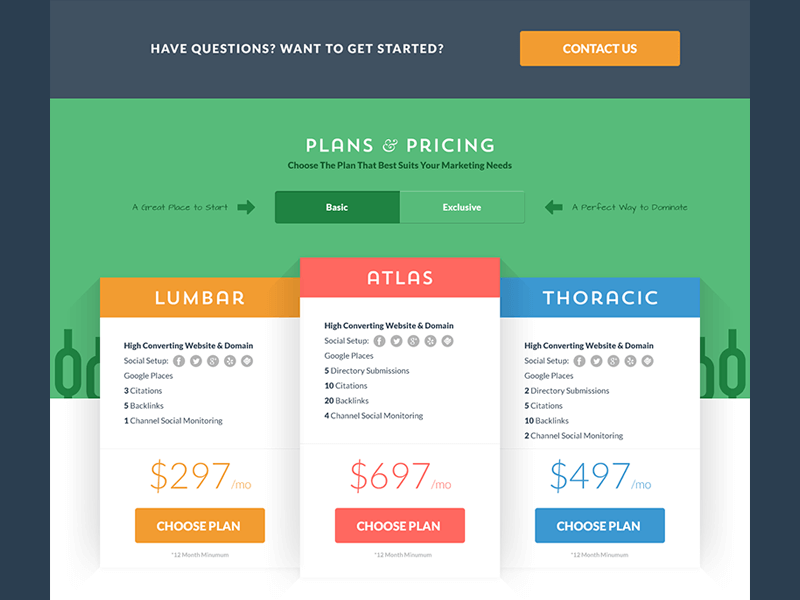
Example of plans and pricing page
Measuring this page value can help you track whether the sum total impact of all your efforts has led to an increase in that page’s value (by measuring how many conversions happen through that page over a given period of time).
Using A/B testing, you can determine which page variant creates most conversions thereby increasing page value and ROI.
In the next Google Analytics for Beginners blog series, Kushal will talk about Enterprise Marketing Analytics.
Explore more posts in Kushal’s Google Analytics Marketing Metrics blog series: