
You’re working hard on lead generation, and you’ve invested in a sales enablement strategy to ensure those leads convert. But the numbers don’t lie — something, somewhere, is just not working.
There is nothing more frustrating than putting in the time, money, and effort to develop what should be a fool-proof system to keep the deals flowing and then watching your lead pipeline slow to a trickle — and then stop. If the leads are still flowing (and your team is agreed on their quality), the issue lies somewhere in the sales department. But how do you measure sales enablement success?
We’re coming to the end of our series on sales enablement, and as we wind things up, I’d like to review some critical sales enablement metrics you can track. They’ll help you figure out which parts of your sales enablement framework are delivering results — and which parts need some tweaking.
From the Top: What is Sales Enablement Again?
It’s been a minute since we talked about this, so let’s start with a quick refresher.
Sales enablement is using content, tools, and knowledge to empower your sales team to close more deals. It’s a collaboration between marketing and sales departments that can only work when those two groups are aligned.
(If those two lines don’t fit with the sales enablement strategy you’ve built, it might be time to go back to square one and rethink your approach.)
But if those principles fit and things still aren’t working, don’t get too down on yourself. The concept of the ideal sales enablement system — a perfectly aligned team collaborating to increase sales velocity — sounds pretty darn great. But the reality is that it’s a lot of hard work. There are a ton of moving pieces, strategies, and processes that all have to run smoothly to make that vision of success a reality.
Which part of your system has let you down? Keep reading and we’ll help you figure it out.
1. Content Metrics
Content plays a vital role in an effective sales enablement strategy, but creating content that goes unused is a waste of time and resources. The average B2B organization only uses 35% of the sales content it produces.
This can be because sales enablement content is inaccessible, hard to find, or not suited to the actual needs of your sales team. It’s also possible that you simply have so much sales content that reps are overwhelmed and don’t know how to apply such a vast library of resources.
Measure Success with Content-Related Sales Enablement KPIs
These sales enablement metrics can help identify which sources and assets are being used to move prospects down the funnel and convert them.
Sales Rep Engagement
This figure measures how often members of the sales team interact with sales enablement content to identify which assets work and which need work.
What to measure:
- What percentage of assets are used compared to the total?
- Which assets are used most, and how often?
- How many top-performing sales reps regularly download content?
Next steps:
Low sales rep engagement suggests a problem with your content. Talk to your sales team to find out what is holding them back from leveraging sales enablement assets.

Content Efficacy
Knowing how much sales reps are using specific content is a great start, but understanding the impact your content has on sales performance — specifically, on closing deals — is also valuable.
What to measure:
- How many assets (and which ones) do prospects consume before converting?
- Where do visitors go after arriving on your website?
- How long do prospects spend reading or watching your content?
Next steps:
If you find that a significant number of deals close without the prospects ever consuming your content, or if site visitors quickly bounce instead of staying on your site to explore what you have to share, your content may not be relevant to buyers. Remap your content against the buyer journey to see what you’re missing.
2. Sales Proficiency Metrics
If content isn’t the problem, maybe your inability to close on leads can be attributed to a discrepancy between your sales targets and your team’s capabilities. Metrics like average win rate, total value of sales, quota attainment, and time to productivity can help uncover issues that could be affecting lead conversion rates.
Measure Success with Sales Proficiency KPIs
These sales enablement metrics can help measure the day-to-day sales performance of individual salespeople, the sales team as a unit, and the entire organization.
Win Rate
Does your team fail to close deals with qualified leads — or is a lack of opportunities the problem? Your win rate is the ratio of successful deals to total sales opportunities.
What to measure:
Divide the number of deals won by the total number of opportunities. Multiply by 100 to get the percentage of successful deals.
Next steps:
A low win rate indicates that your team has missed a lot of opportunities to close deals. Dig in further to see if specific tactics or sales reps are causing your team to drop the ball.

Quota Attainment
Is your sales team doing the best they can in the face of unrealistic expectations? Tracking the percentage of salespeople who meet or exceed quotes can help identify a problem with targets vs. reality.
What to measure:
Divide the number of sales representatives who make their quote by the total number of sales reps in your organization. Multiply by 100 to get the percentage that hits quotas.
Next steps:
If less than 60% of your sales reps regularly meet their quotas, your goals may be unrealistic and need reevaluation. A small percentage of salespeople missing targets presents a training opportunity to help underperformers excel.
Time to Productivity
No salesperson is going to join your team and immediately start closing deals. They need to ramp up their skills and experience before they can be fully productive. Knowing how long it takes to get sales reps to full power can help you understand why sales may be lagging.
What to measure:
How long, on average, do new sales representatives on your team spend in each of these stages before they start closing deals?
- Onboarding
- Training
- Shadow experience
- Hands-on experience
Next steps:
If some (or all) members of your sales team are taking a long time to get up to speed, you should probably examine your hiring and onboarding strategies to see if updates are required.
3. Account-Based Marketing Metrics
Account-based marketing (ABM) focuses on engaging a small number of high-quality prospect accounts instead of individual leads, with the goal of closing larger deals. 81% of marketers report achieving a higher ROI with ABM — there’s no wonder its popularity has grown.
Account-based marketing requires a relatively high sales enablement maturity level. If your organization doesn’t have a standalone sales enablement functions or, at very least, a high level of collaboration across sales and marketing teams, ABM is probably not for you.
Measure Success with Account-Based Marketing KPIs
Don’t assume that leveraging ABM will automatically boost revenue and profits. Monitor these sales enablement metrics to see if your ABM strategy is really delivering.
Sales Cycle Length
The larger account sizes associated with account-based marketing typically come with longer sales cycles. Tracking the length of your sales cycle can help identify areas for improvement in your sales enablement strategy.
What to measure:
Divide the number of days it takes to complete each sale by the total number of deals closed.
Next steps:
Once you’ve established a baseline sales cycle length, you can experiment with different tactics and strategies (especially in later stages) to help close deals faster and more effectively.
Pipeline Velocity
How fast are your target accounts advancing from MQAs to the final stage of your ABM funnel? Measuring pipeline velocity is a vital element of a data-driven marketing strategy.
What to measure:
- Time from opportunity creation to closing
- Time spent on each opportunity stage
Next steps:
Lower-than-expected pipeline velocity suggests a need to increase the number of accounts at the top of your funnel. Review your digital advertising strategy to increase opportunities, deals, and revenue.

4. Social Selling Metrics
Buyers are online almost constantly, and failing to meet them where they are is not a mistake today’s marketers can afford to make. Point of fact: HubSpot’s 2024 State of Sales report ranks social media among the four most effective sales channels.
Measure Success with Social Selling KPIs
The metrics you use to measure the success of social selling efforts will vary based on your organization’s sales enablement maturity level.
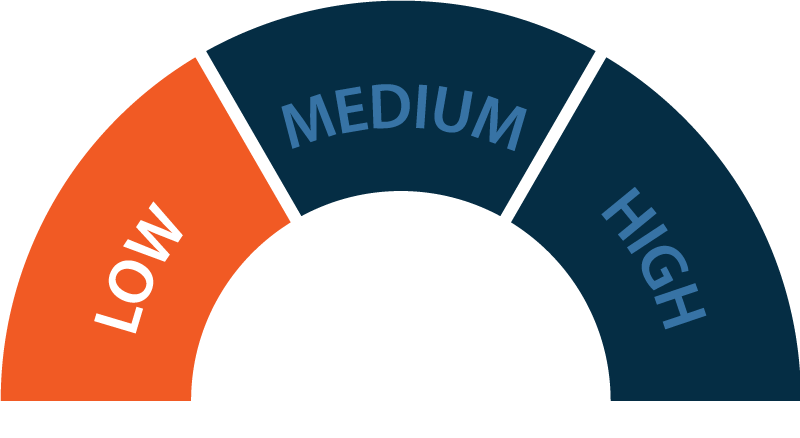
Low
Network growth
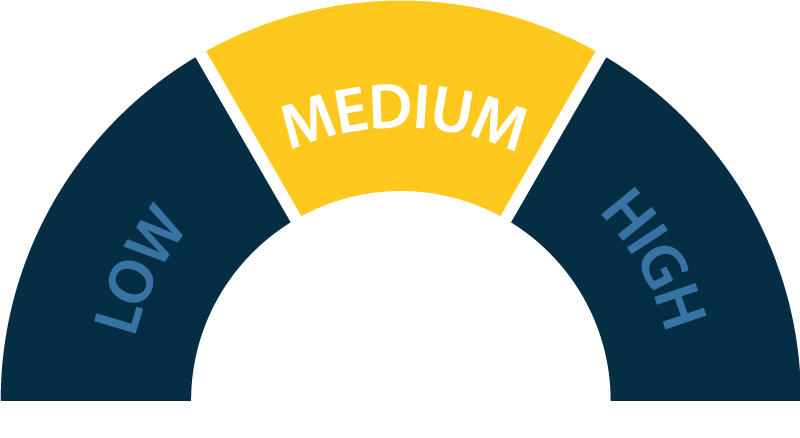
Medium
Second-degree connections
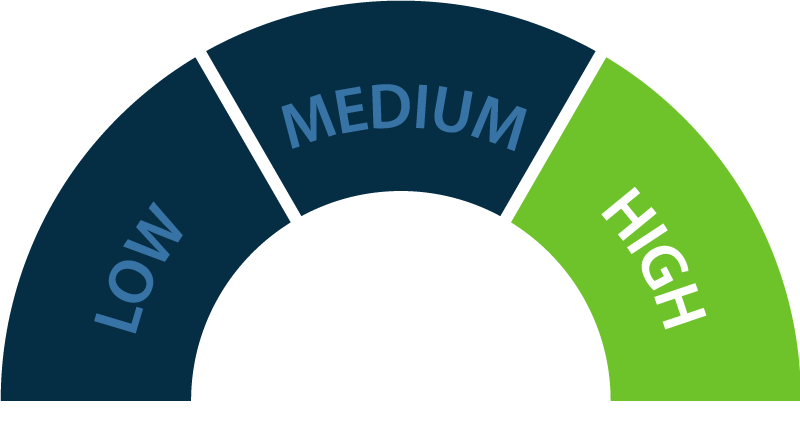
High
But remember, social selling activities will not always lead to a sales conversion. Calculating social selling ROI should include examining how your work on social media affects prospect nurturing and lead generation as well as deals.
Using Sales Enablement Metrics to Improve
Now that you’re measuring and monitoring all aspects of your sales enablement strategies, what do you do with the information you collect?
Start by sharing the information with the relevant stakeholders on your team. Reports on content, sales proficiency, account-based marketing, and social selling can help ensure sales, marketing, and leadership are all on the same page about current capabilities, goals, and the steps required to achieve them.
Give some thought to what is and isn’t working for your sales reps by doing regular sales process audits — either through data-backed analysis of your sales process or by watching your salespeople in action.
What did your most recent deal look like from beginning to end? What were the customer touchpoints? How can you use these metrics to improve the process? With data from these sale enablement metrics in hand, you have the power to improve and accelerate your sales process.
Still struggling with sales enablement? The experts at TPM are here to help. Contact us today.
Enjoyed this read?
See our full collection of Sales Enablement blogs to close more deals, faster!